Pekka Niittyvirta & Timo Aho (FI) – Lines (Helsinki)

Event Introduction
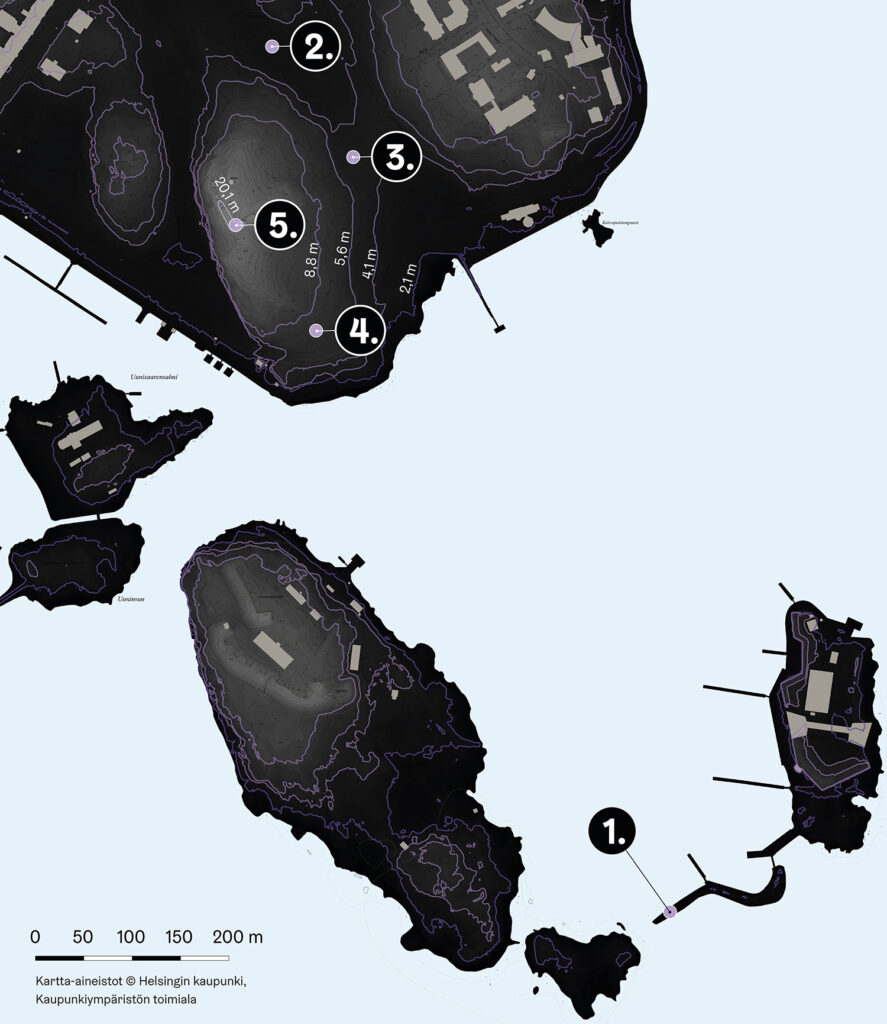
Note: The artwork spans four locations in Kaivopuisto and Särkkä Island when looking southward. The installation can be viewed in its entirety from Iso Puistotie.
The work can also be seen at Lux Morning on January 9–10, 2025, from 7 to 9 a.m.
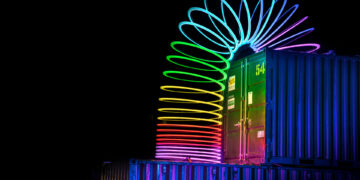
The installation creates an immersive experience that visualizes sea level rise caused by climate change.
Scenarios based on the IPCC Climate Change Panel report and local ground elevation range from realistic predictions for the coming decades to more speculative estimates hundreds of years into the future.
The installation explores the interactive relationship between humans and nature, as well as environmental impacts.
Timo Aho & Pekka Niittyvirta
Timo Aho and Pekka Niittyvirta are Helsinki-based visual artists known for their site-specific light installations. The artists work in collaboration with scientists to create scientifically accurate installations often in interaction with natural elements like tides and the sun.
Their notable installation Lines (57° 59 ́N, 7° 16 ́W), was first exhibited at the Taigh Chearsabhagh Museum and Art Center in 2018, utilising 120 meters of synchronised lines of light to depict the dire consequences of rising sea levels in connection with tidal changes. With a shared passion for societal and ecological issues, they strive to address topical phenomena in public spaces.
Their recent collaborations include the large-scale light installations (2022–2023) across Ireland in collaboration with scientists and researchers from Trinity College Dublin, Maynooth University, and the A4 research team, as well as projects with WAM Turku City Art Museum, Google Arts and Culture, and UNTITLED Art Miami.

List of locations:
- The breakwater. 2.1 m above sea level. Could be under high water as early as 2065.
- The fallen willow. 4.1 m. Under high water in 2110.
- The maples. 5.6 m. Under high water in the 2140s.
- The rapakivi boulder. 8.8 m. Under high water before 2300.
- The observatory. 20,1 m. Under high water possibly as early as 2500.
Locations 1 to 3 use the upper value for the sea level from the 95% probability distribution of the IPCC AR6 low confidence scenario*. This is an upper end scenario where emissions keep rising. While a sea level rise of this speed and magnitude is unlikely, it also cannot be entirely excluded. The sea level rise figures are calculated relative to the 1995–2014 average. To this has been added Helsinki’s previous record sea water level of +151 cm (above the theoretical average water level). Not only will global warming increase the average sea level, it will also increase the variability of sea levels and the risk of extreme high water. The effect of waves raises sea levels even higher during storms.
The city has estimated that in southern Helsinki, the safe building height by 2100 would be +292 cm above current sea level and as much as +335 cm in areas exposed to waves. The safe building height means the lowest height to which sea floods will not rise, even in the event of exceptionally strong sea surges. Houses built below this level could therefore be exposed to sea flooding before 2100.
These estimates take into account the effect of land uplift, which in the Helsinki region is as little as +4 mm per year.
The development of emissions does matter: in the moderate SSP2-4.5 Medium Confidence scenario, the average sea level in Helsinki is estimated to rise by only 36 cm by 2150 (the middle value of the 50% probability distribution), leaving even the breakwater above water at that point.
The estimate for location 4, the rapakivi boulder, is based on the article ”A high-end estimate of sea level rise for practitioners” (2022), which sought to estimate possible sea level rise further into the future if global temperatures continue to rise.
The estimate for location 5, the observatory, is based on the assumption that atmospheric carbon dioxide levels were last this high in the Pliocene Epoch 3 million years ago. At that time, the global mean sea level was estimated to be 17.5 m (± 6.4 m) higher than today. As melting of the continental ice sheets is a slow process, the sea level will under any scenario take centuries to rise this high, but the process is inevitable unless the global average temperature can be turned into decline.
*) Sixth Assessment Report of the Intergovernmental Panel on Climate Change, very high GHG emissions scenario (SSP5-8.5 Low Confidence)
Data processing and map: Koponen+Hildén koponen-hilden.fi
Sources:
NASA 2016. ’Sea Level Projection Tool’.
Ilmatieteen laitos, 2024. ’Vedenkorkeustilastot’ (Sea level statistics).
van de Wal, R. S. W., et al. 2022. ’A high-end estimate of sea level rise for practitioners’. Earth’s Future, 10, e2022EF002751.
Hollyday, A. et al. 2023. ’A Revised Estimate of Early Pliocene Global Mean Sea Level Using Geodynamic Models of the Patagonian Slab Window’. Geochemistry, Geophysics, Geosystems, 24(2), p. e2022GC010648.
Pellikka, H. et al. 2022. ’Probabilistic projections and past trends of sea level rise in Finland’. Natural Hazards and Earth System Sciences.
Kahma, K. et al. 2024. ’Ohje turvallisten rakentamiskorkeuksien soveltamiseksi Helsingin merenrannoilla’ (Guide for applying safe construction height limits on the Helsinki seashore). Kaupunkiympäristön aineistoja 2024:13.
Categories
Map
Event Information
-
Time:
-
8.–12.1.2025 klo 17–22
-
-
Address:
Kaivopuisto (Iso Puistotie)


